
Every brain generates electrical activity - measurable patterns of neural communication that reflect how we think, feel, and regulate our behavior. Standard clinical electroencephalography (EEG) records these signals. Quantitative EEG (qEEG) goes further: it applies mathematical and statistical analysis to those recordings, transforming raw brainwave data into detailed, comparable brain maps.
This guide explains what qEEG is, how it differs from standard EEG, where it is used clinically, and why it matters for the future of personalized neurofeedback - including the approach taken by the CURATOR project.
How Standard EEG Works
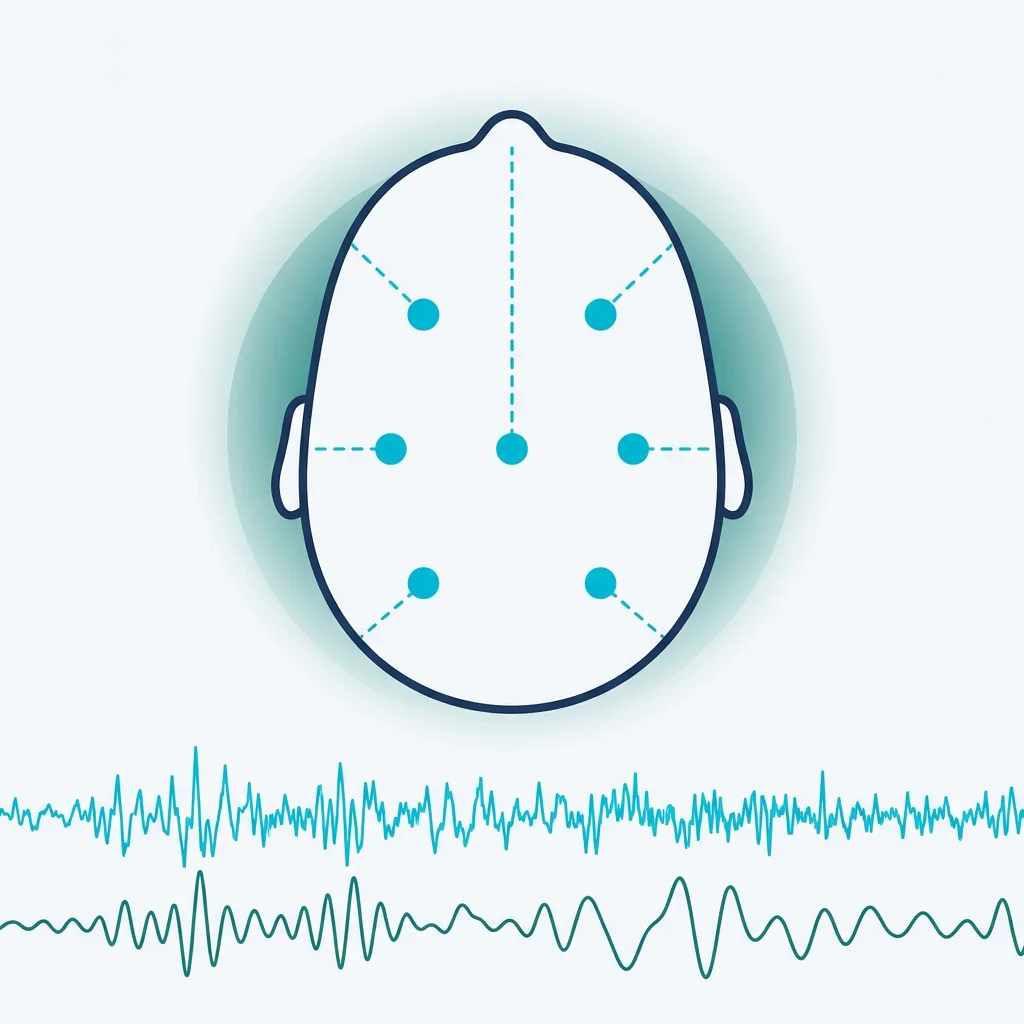
A standard clinical EEG records the electrical activity of the brain through electrodes placed on the scalp, typically using the international 10-20 system (19 or more electrode positions). A trained neurophysiologist visually inspects the resulting waveforms, looking for abnormalities such as epileptiform discharges, slowing, or asymmetries.
Clinical EEG excels at detecting structural and acute neurological events - epilepsy, encephalopathy, sleep disorders. It has been a cornerstone of clinical neurology since Hans Berger’s first human EEG recording in 1924.
However, visual inspection has inherent limitations. It depends on the clinician’s experience, focuses primarily on identifying clearly abnormal patterns, and does not easily quantify subtle differences between individuals or track changes over time with precision.
From EEG to qEEG: What Changes
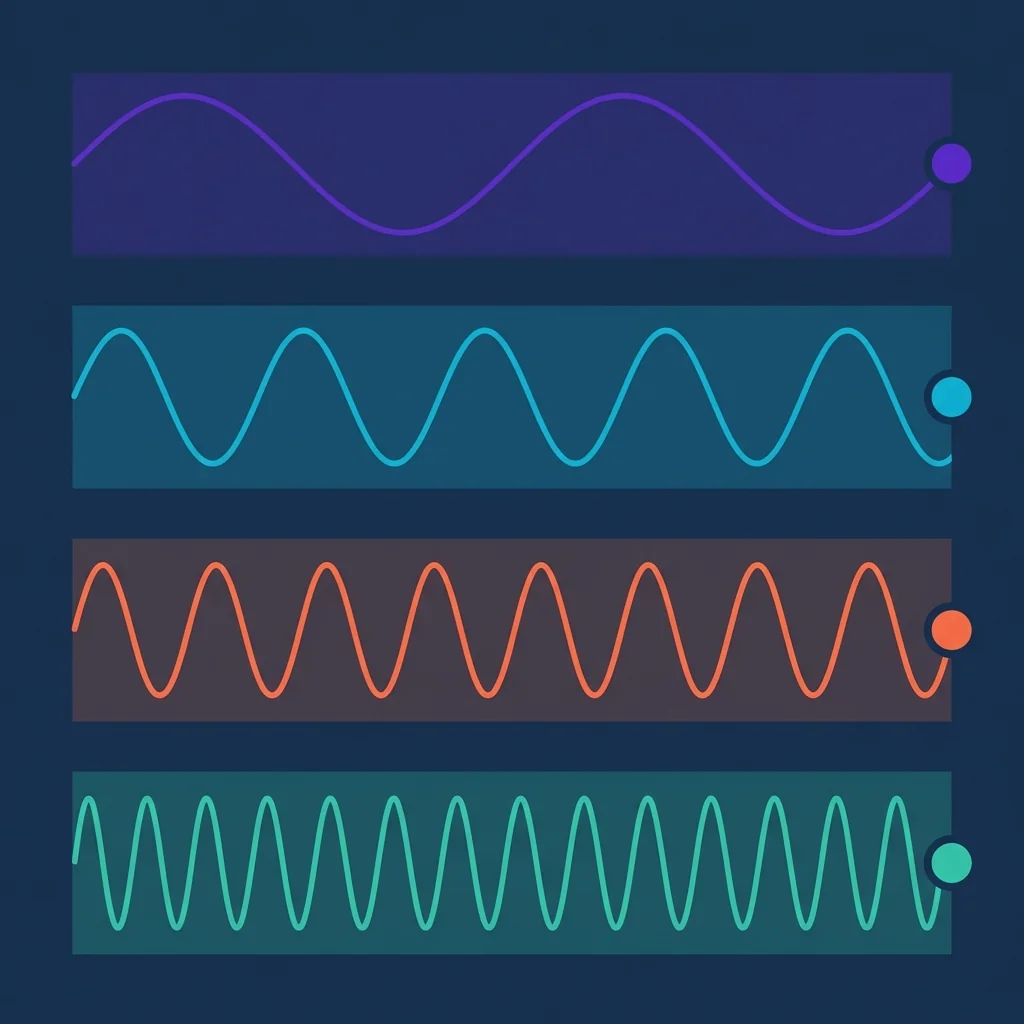
Quantitative EEG takes the same electrical signals recorded by standard EEG and subjects them to digital signal processing. The core transformation involves decomposing the raw EEG signal into its constituent frequency components using mathematical methods such as the Fast Fourier Transform (FFT).
This process produces precise measurements including:
- Absolute and relative power in each frequency band (delta, theta, alpha, beta, gamma)
- Power ratios between bands, such as the theta/beta ratio (TBR), which has been extensively studied in attention deficit conditions
- Coherence and connectivity measures that reflect how different brain regions communicate
- Asymmetry indices comparing activity between the left and right hemispheres
- Peak frequencies, including individual alpha peak frequency (iAPF), which varies between individuals and carries clinical significance
The result is a quantitative profile - a set of numbers that describe the brain’s electrical behavior with statistical precision rather than subjective visual judgment.
The Role of Normative Databases
Raw qEEG values carry limited meaning on their own. The question is not simply “how much theta power does this brain produce?” but rather “how does this brain’s theta power compare to what is typical for a person of this age and sex?”
This is where normative databases become essential. A qEEG normative database contains reference data from healthy individuals, organized by age and often by sex. When a clinician records a patient’s qEEG, the system compares each measurement against this reference population and expresses the result as a z-score - a standardized measure indicating how many standard deviations the individual’s value falls from the population mean.
A z-score of 0 indicates a value exactly at the population average. A z-score of +2 or -2 suggests the measurement falls outside the range observed in approximately 95% of the reference population - a statistically meaningful deviation.
Several validated normative databases are available to clinicians, including NeuroGuide, qEEG-Pro, and the Lifespan database. Each differs in population size, demographic composition, recording conditions, and the statistical methods used for age regression. These methodological differences mean that clinical interpretation should account for which database was used. The CURATOR project’s WP1 research program addresses this challenge directly by developing a standardized biomarker framework for encoding EEG features - designed to be interoperable across platforms and compliant with the Brain Imaging Data Structure (BIDS) standard.
How qEEG Brain Mapping Works in Practice
A typical qEEG assessment follows a structured protocol:
-
Recording: The clinician acquires a multi-channel EEG, usually with 19 channels using the 10-20 electrode placement system. Recordings include both eyes-open and eyes-closed resting-state conditions, and may include task-based segments.
-
Artifact removal: Raw recordings contain noise from eye movements, muscle tension, heartbeat, and electrode contact issues. Preprocessing applies bandpass filtering, notch filtering (to remove power-line interference), bad-channel detection, and artifact rejection using techniques such as independent component analysis (ICA).
-
Quantitative analysis: Clean EEG segments are transformed into frequency-domain representations. Power spectral density is computed for each channel across the standard frequency bands. Connectivity metrics, asymmetry ratios, and other derived measures are calculated.
-
Normative comparison: Each metric is compared to the appropriate age- and sex-matched reference data, producing z-score maps that highlight statistically significant deviations.
-
Topographic mapping: Results are displayed as color-coded brain maps (topographic maps), making it possible to visualize which regions show elevated or reduced activity in specific frequency bands at a glance.
The entire process transforms a subjective clinical recording into a standardized, reproducible quantitative assessment.
Clinical Applications of qEEG
Quantitative EEG has established applications across several clinical and research domains:
Neurology
qEEG is used alongside standard clinical EEG for evaluating traumatic brain injury (TBI), monitoring cerebral function in intensive care, and providing supplementary information in the assessment of dementia and mild cognitive impairment. The American Clinical Neurophysiology Society has issued guidelines on the clinical use of qEEG, emphasizing that it should complement - not replace - standard clinical EEG interpretation.
Psychiatry and Behavioral Health
Research has identified qEEG patterns associated with conditions including ADHD, depression, anxiety disorders, and obsessive-compulsive disorder. The theta/beta ratio, for example, received FDA clearance in 2013 as a supplementary diagnostic aid for ADHD in the NEBA system - though it should be noted that this applies to one specific commercial implementation, not to TBR measurement in general.
qEEG-informed treatment selection is an active area of investigation. Studies have explored whether baseline qEEG profiles can predict response to specific medications or therapeutic interventions, with the goal of reducing the trial-and-error period that patients often experience.
Neurofeedback Protocol Selection
This is where qEEG intersects most directly with the CURATOR project’s mission. In neurofeedback (also known as EEG biofeedback), a person learns to modify their own brainwave patterns through real-time feedback. The clinician must select a training protocol - deciding which frequencies to target, at which electrode locations, and in which direction (increase or decrease).
Traditionally, this protocol selection has relied heavily on the clinician’s training and experience. Two clinicians reviewing the same qEEG may arrive at different protocol recommendations. Outcomes vary across individuals, and protocol mismatch is one proposed contributor to non-response; CURATOR treats this as a research question rather than an established performance claim.
qEEG-guided neurofeedback aims to make this selection more systematic. By identifying specific patterns of deviation from normative data, clinicians can target the most clinically relevant features of an individual’s brain activity rather than applying generic, diagnosis-based protocols.
qEEG and the CURATOR Approach
The CURATOR project - funded by the Luxembourg National Research Fund (FNR) and involving the University of Luxembourg and Neurofeedback Luxembourg - investigates how qEEG biomarkers, phenotype context, and machine learning can support more transparent neurofeedback protocol recommendations.
The project will evaluate candidate features across several domains:
- Spectral power across standard frequency bands
- Connectivity metrics reflecting inter-regional communication
- Event-related potential (ERP) morphology capturing the brain’s response patterns
The feature set, validation cohort, analysis code, cross-validation design, and performance estimates will be reported when a citable protocol, preprint, paper, or public validation report is available. Until then, CURATOR does not present internal development figures as established clinical evidence. The integration of machine learning with qEEG analysis remains an active and rapidly developing research frontier.
CURATOR supports clinical decision-making. The clinician always decides.
Current Evidence and Limitations
Scientific rigor requires acknowledging both the strengths and the boundaries of qEEG:
What qEEG does well:
- Provides objective, reproducible measurements of brain electrical activity
- Enables statistical comparison against age-matched reference populations
- Supports longitudinal tracking of changes over time
- Offers a non-invasive, relatively low-cost neuroimaging modality
Where caution is warranted:
- qEEG is not a standalone diagnostic tool for psychiatric conditions. It provides supplementary information within a broader clinical assessment.
- Normative database quality varies. Not all databases meet the same standards for population size, demographic representativeness, or statistical methodology.
- The clinical significance of specific z-score deviations depends on context - a statistical deviation is not automatically a clinical problem.
- The evidence base for qEEG-guided treatment selection, while growing, is still maturing. Large-scale randomized controlled trials are needed to establish definitive clinical utility for specific applications.
These limitations are precisely what motivates projects like CURATOR - building the evidence base systematically, with validated datasets and reproducible methodology.
Frequently Asked Questions
What is the difference between EEG and qEEG?
Standard EEG records the brain’s electrical activity and is interpreted visually by a neurophysiologist, primarily to detect abnormalities such as epilepsy or encephalopathy. Quantitative EEG (qEEG) applies mathematical and statistical analysis to those same recordings - computing power spectra, connectivity measures, and other metrics - and compares the results to normative reference databases using z-scores. In short, EEG is the recording; qEEG is the statistical analysis of that recording.
What does a qEEG show?
A qEEG produces a quantitative profile of the brain’s electrical activity across multiple frequency bands (delta, theta, alpha, beta, gamma) at each electrode location. It shows how much power the brain generates in each band, how different regions are connected, whether there are asymmetries between hemispheres, and how these measurements compare to age-matched reference populations. Results are typically displayed as color-coded topographic brain maps.
Is qEEG used to diagnose conditions?
qEEG is not a standalone diagnostic tool for psychiatric or neurological conditions. It provides objective, quantitative data that can supplement clinical assessment. Specific qEEG markers have been studied in the context of ADHD, depression, anxiety, TBI, and other conditions, but diagnosis remains a clinical judgment integrating multiple sources of information. The FDA-cleared NEBA system uses a specific qEEG metric (theta/beta ratio) as a supplementary aid for ADHD evaluation, but this represents one specific, validated implementation rather than a general diagnostic claim for qEEG.
How is qEEG used in neurofeedback?
In neurofeedback, qEEG serves as the foundation for treatment planning. The clinician uses the qEEG assessment to identify which aspects of the patient’s brain activity deviate most from typical patterns, then selects a neurofeedback training protocol targeting those specific features. For example, elevated frontal theta relative to beta might lead to a protocol that trains the brain to reduce theta and increase beta activity. qEEG-guided protocol selection aims to personalize treatment rather than applying a one-size-fits-all approach based solely on diagnosis. This personalization challenge - matching the right protocol to the right brain - is the central research question driving the CURATOR project.
CURATOR is a research project supported by the Luxembourg National Research Fund (FNR). It develops and evaluates methods for personalizing neurofeedback protocol recommendations based on qEEG analysis and machine learning. CURATOR supports clinical decision-making - the clinician always decides.